


Primary students (K-2): color recognition, counting, shapes, numeral recognition, beginning addition, skip counting by fives, equal parts, data analysis
Intermediate students (3-5): addition, multiplication, equal parts, fractions, decimals, data analysis, angle measurement
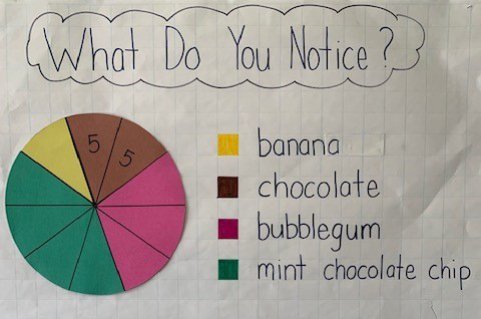
This simple pie graph gets students to think about and analyze data in a fun way.
The first thing most students will notice is that the poster has something to do with... pies? ice-cream? I deliberately left off a title so they could come up with an idea of what the graph represented. We're not always given all the information and this is good thinking practice.
Then young students will probably notice that the graph is in the shape of a circle which is divided up into sections. They can notice that each section is equal in size and might even say that the sections look like triangles.
They can also count the number of sections (10) and notice there are two number 5s and may even add them to get 10. Since students can see that each equal section is equal to 5, they can determine the value of each of the flavors.
This graph also introduces them to legends where they can match the flavors listed in the legend to the sections on the pie graph.
When analyzing the data, they'll notice that banana has the least and mint chocolate chip has the most. In what ways would this information be useful? This may not come up at your Family Math Night event, but it's a great question to ask in the classroom.
Intermediate students can determine that if each section is equal to 5, then the entire graph represents a total of 50. Super savvy students, with the help of their parent, may figure out that if they double each section so that it equals 10, then the entire graph equals 100. From here they can determine the percentage of each flavor.
These students can also notice fractions. If each section represents one tenth of the entire circle, they can determine the fractional value of each flavor.
At an even higher level, these older students may notice that the angle measurement of each section is equal to 36 degrees (360 degrees divided by 10 sections = 36 degrees/section). From here they can determine the angle measurement of each of the colored sections.
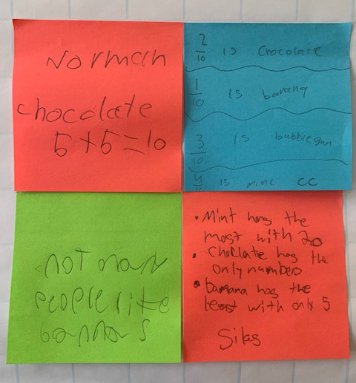
"chocolate 5 + 5 = 10"
"not many people like banana"
"2/10 is chocolate, 1/10 is banana, 3/10 is bubblegum, 4/10 is mint chocolate chip"
"mint has the most with 20; chocolate has the only numbers; banana has the least with only 5"