


Primary students (K-2): number recognition, counting
Intermediate students (3-5): reading a graph, skip counting by 2's, logical thinking
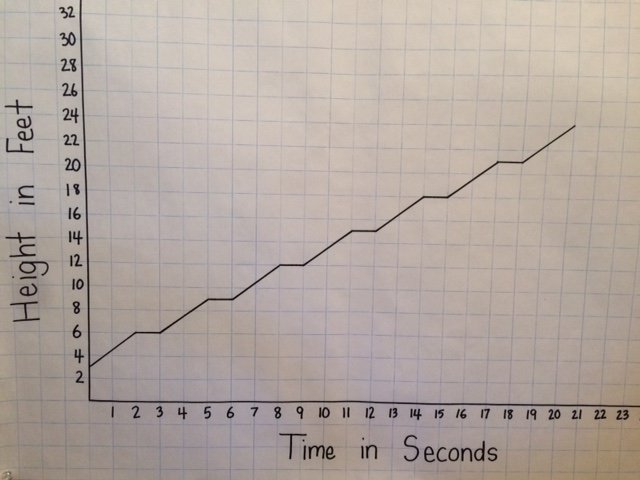
This line graphs shows data that has to do with something getting higher over a period of time. I deliberately did not title the graph to give students an opportunity to think logically about what might be happening. They should notice that the height starts off the ground at 3 feet. Then for every two seconds there's an increase of 2 feet followed by a "rest" of 1 second. The pattern is consistent until the height of 24 feet is reached.
This graph depicts someone raising the flag on a flagpole. Most school flagpoles are 25' so the 24' on the graph is pretty close. It's not an easy graph to figure out but lends itself to some interesting discussion.