


Primary students (K-2): shapes, colors, relative sizes, circle graphs
Intermediate students (3-5): fractions, money, circle graphs
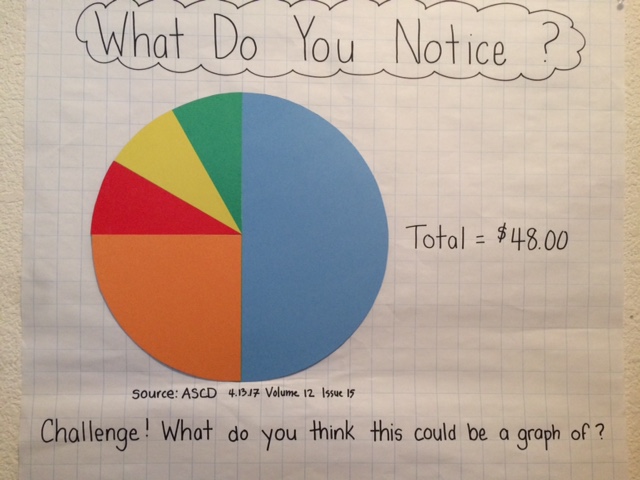
This graphic represents a circle graph (also called pie chart). A circle graph is a visual representation of data comparing parts to the whole. Circle graphs can lend themselves well to the study of fractions. This circle is divided into sections that represent fractions of the whole. In our case, the whole is $48. The idea is to have upper elementary students determine the dollar amount of each section. Students can also determine the specific fraction represented by each color. They are also able to identify equivalent fractions such as 1/4 = 3/12.
I also added a 'Challenge!' questions to get them thinking about what the graph could represent.
(Source of circle graph: ASCD 4.13.17 Volume 12 Issue 15)
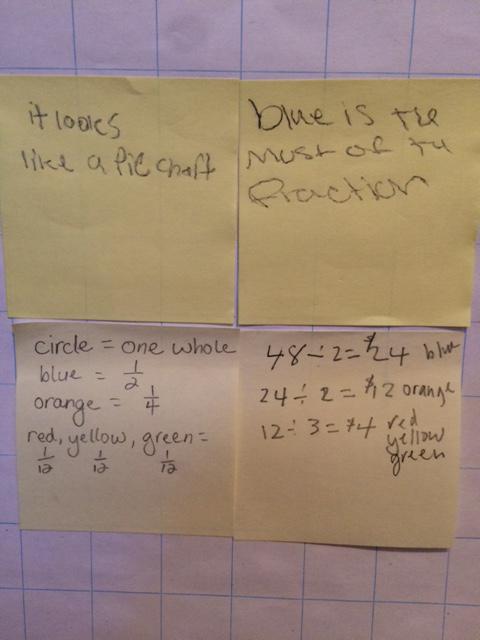
"It looks like a pie chart."
"Blue is the most of the fraction."
"Circle = one whole. Blue = 1/2. Orange = 1/4. Red = 1/12. Yellow = 1/12. Green = 1/12."
"48 ÷ 2 = $24 blue; 24 ÷ 2 = $12 orange; 12 ÷ 3 = $4 red, yellow, green."